SQL-Native Anomaly Detection: Catching Data Entry Errors at Scale

Someone entered a bolt at 1.25. Your ERP approved the order. Nobody noticed until the invoice arrived.
Decimal place errors. Extra zeros. Copy-paste mistakes. They happen constantly in procurement systems, ERP data entry, and master data management. The question isn't whether your data has errors—it's how many you're catching.
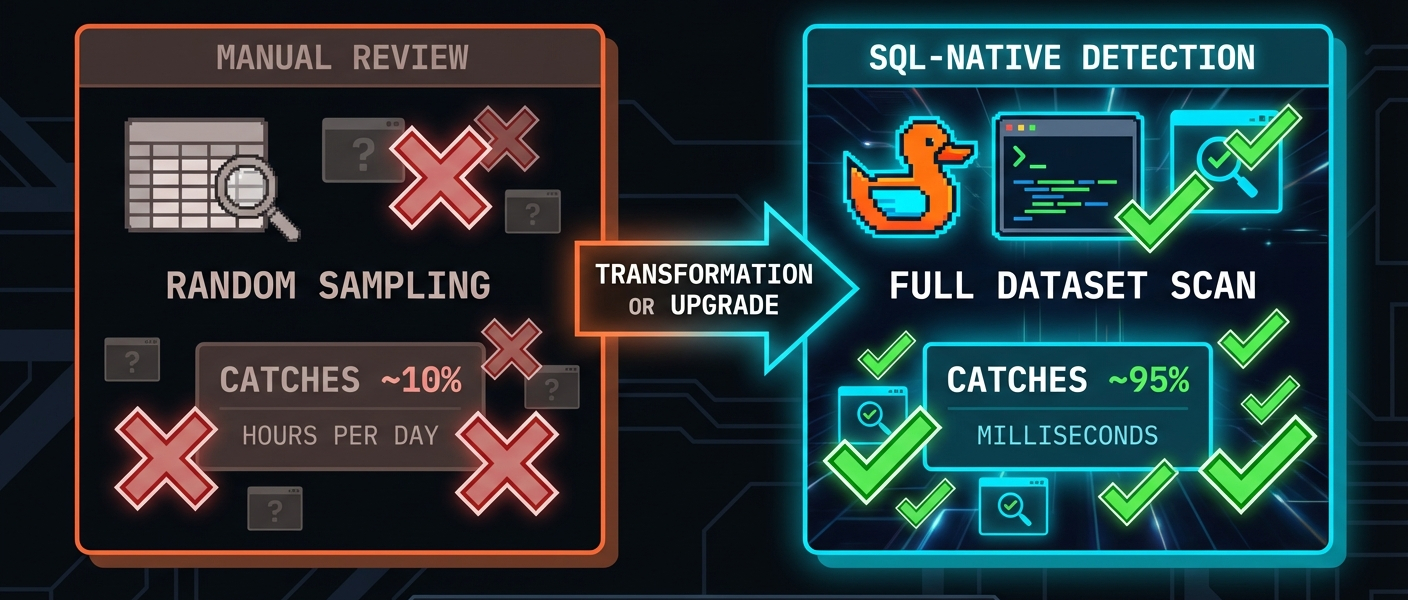
Manual review doesn't scale. With aggregated BI views it is easy to miss the 0.1% of orders that are actually wrong. And by the time finance flags a suspicious invoice, you've already paid.
We built something different. AI anomaly detection that runs inside DuckDB. No data exports. No Python scripts. Just SQL.
The Problem: Data Entry Errors Are Invisible
Here's a typical procurement orders table:
SELECT supplier, category, unit_price, quantity
FROM procurement_orders
ORDER BY order_id DESC
LIMIT 5;
| supplier | category | unit_price | quantity |
|---|---|---|---|
| FastenAll Corp | FASTENERS | 125.00 | 500 |
| ACME Industrial | ELECTRONICS | 45.00 | 100 |
| MetalWorks GmbH | RAW_MATERIALS | 28.50 | 750 |
| Pacific Parts | PACKAGING | 2.80 | 450 |
| Atlas Components | FASTENERS | 0.85 | 1200 |
Spot the problem? The first row. Fasteners don't cost 1.25. Someone moved the decimal, accidentally.
This order will sail through approval workflows. It's under budget thresholds. The supplier is legitimate. The quantity is reasonable. Nothing triggers a flag.
But that single error? It's a 100x overpayment.
Now multiply this across thousands of orders, dozens of users, multiple systems. How many are you missing?
The Solution: Statistical Anomaly Detection
Instead of rules ("reject if price > $100"), we ask a different question: does this value fit the pattern of normal data?
A bolt at 125 is inherently wrong, but because it's wildly different from other fastener prices in your data.
INSTALL anofox_tabular FROM community;
LOAD anofox_tabular;

-- Find pricing anomalies using Isolation Forest
SELECT order_id, supplier, category, unit_price, anomaly_score
FROM metric_isolation_forest('procurement_orders', 'unit_price')
JOIN procurement_orders USING (order_id)
WHERE is_anomaly = true
ORDER BY anomaly_score DESC;
Results:
| order_id | supplier | category | unit_price | anomaly_score |
|---|---|---|---|---|
| 9001 | FastenAll Corp | FASTENERS | 125.00 | 0.89 |
| 9002 | ACME Industrial | FASTENERS | 85.50 | 0.85 |
| 9012 | Pacific Parts | RAW_MATERIALS | 999.99 | 0.92 |
| 9011 | ACME Industrial | FASTENERS | 0.001 | 0.78 |
The 85.50 one (should be 999.99 "raw material" that someone probably fat-fingered.
Zero configuration. No threshold tuning. No domain-specific rules. The algorithm learns what "normal" looks like from your data and flags what doesn't fit.

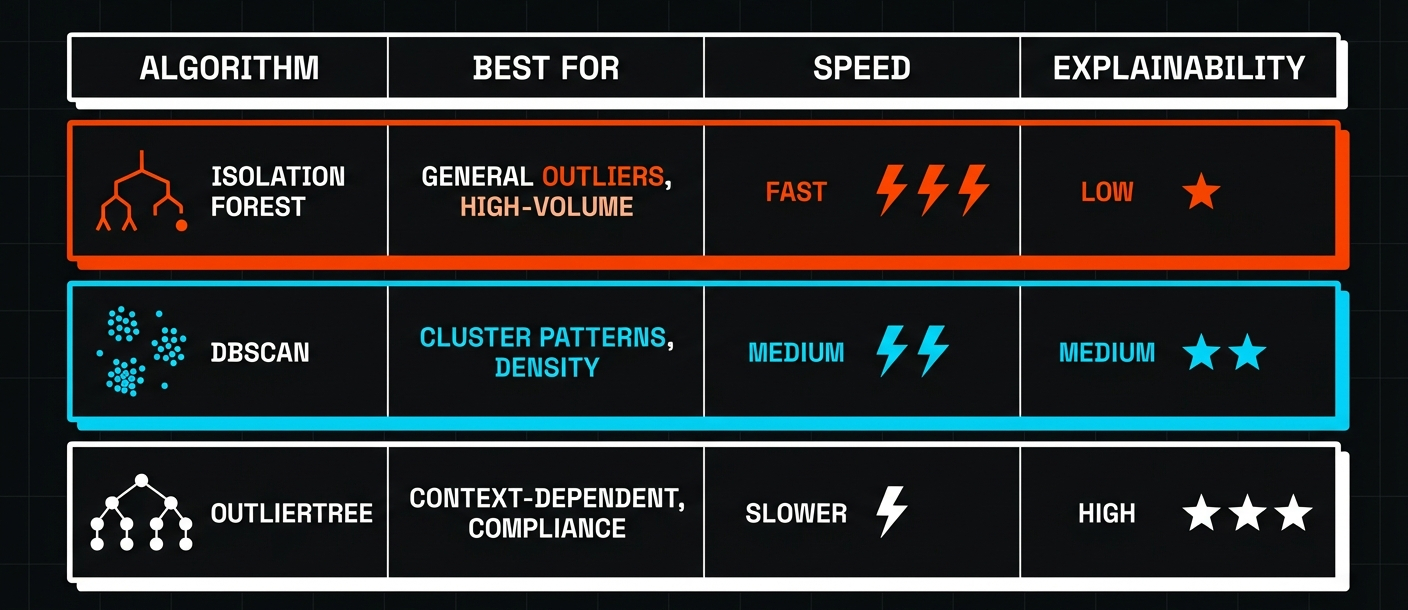
Three Algorithms, Three Superpowers
anofox-tabular includes three anomaly detection algorithms. Each solves a different problem:
| Algorithm | Best For | Speed | Explainability |
|---|---|---|---|
| Isolation Forest | General outliers, high-volume scanning | Fast | Low |
| DBSCAN | Cluster-based patterns, density analysis | Medium | Medium |
| OutlierTree | Context-dependent anomalies, compliance | Slower | High |
When to Use Each
Isolation Forest is your first line of defense. It's fast—thousands of rows per second—and catches obvious outliers without tuning. Use it for daily scans of new data.
DBSCAN finds patterns that Isolation Forest misses. If your anomalies cluster together (like a batch of orders from one user with systematic errors), DBSCAN will catch them.
OutlierTree answers the question everyone asks: "Why is this flagged?" Instead of an anomaly score, you get explanations like:
"Price 0.85 ± $0.45 for supplier FastenAll Corp)"
We'll cover each algorithm in depth in the next post. For now, Isolation Forest handles 80% of use cases.
Multivariate Detection: Beyond Single Columns
Single-column analysis catches obvious errors. But some anomalies only appear when you look at multiple columns together.
A $45 unit price is normal. A quantity of 10,000 is normal. But $45 × 10,000 = $450,000 for a single line item? That's suspicious—even if each value alone looks fine.
-- Multivariate anomaly detection across price and quantity
SELECT order_id, supplier, unit_price, quantity, line_total, anomaly_score
FROM metric_isolation_forest_multivariate('procurement_orders', 'unit_price, quantity')
JOIN procurement_orders USING (order_id)
WHERE is_anomaly = true
ORDER BY anomaly_score DESC;
| order_id | supplier | unit_price | quantity | line_total | anomaly_score |
|---|---|---|---|---|---|
| 9013 | FastenAll Corp | 0.50 | 99999 | 49999.50 | 0.94 |
| 9004 | Pacific Parts | 45.00 | 10000 | 450000.00 | 0.91 |
| 9001 | FastenAll Corp | 125.00 | 500 | 62500.00 | 0.88 |
Now we're catching the quantity errors too—the extra zeros that slipped past single-column analysis.
Why SQL Matters
You could do this in Python. Load the data into pandas, run scikit-learn's Isolation Forest, export results back to your database. We tried that. Here's what we learned:
-
-> Data movement is expensive. Export 10GB of orders, run ML, import results. For daily scans, that's a pipeline to maintain.
-
-> Context switching kills productivity. Your analysts know SQL. They don't want to debug Python environments.
-
-> Small data runs faster in SQL. For datasets under 1M rows—which covers most operational data—DuckDB's vectorized C++ implementation beats Python overhead.
Try It Yourself
INSTALL anofox_tabular FROM community;
LOAD anofox_tabular;

-- Basic anomaly detection on a column
SELECT * FROM metric_isolation_forest('your_table', 'price_column')
WHERE is_anomaly = true;

-- Multivariate (multiple columns)
SELECT * FROM metric_isolation_forest_multivariate('your_table', 'col1, col2, col3');

-- Quick summary: pass 'summary' as the 6th parameter
SELECT * FROM metric_isolation_forest('your_table', 'price_column', 100, 256, 0.1, 'summary');
Start with your highest-risk data: pricing, quantities, amounts. Run a scan. You might be surprised what's hiding in there.
In this series:
- SQL-Native Anomaly Detection — What it does and when to use it (this post)
- Choosing the Right Algorithm — Isolation Forest vs DBSCAN vs OutlierTree
- Explaining Anomalies to Stakeholders — OutlierTree and production pipelines
All of this runs in SQL. No external services, no data exports, no Python dependencies.